 GoDetect™ ESD Instructions
GoDetect™ ESD Test and Camera Setup Instructions
- Secure the camera to the base, attach any necessary extension tubes, attach the lens, and set the fstop to 16
- Start PCC, Phantom Camera Control, and connect to the camera to see a live image
- Within PCC, set the resolution to 256x256
- Set the camera to a low light setting or a low frames per second setting to more easily see the electrode/ needle
- Recenter the camera if necessary such that the needle (when down) and the entire metal electrode is centered and in view
- Focus the camera on the needle (when down)
- Undo the low light setting and set the collection rate to 5000 frames per second
- Verify that the trigger is functioning.
- Ensure that the coax cable from the BNC connector on top of the ESD machine is connected to the BNC connector on the camera labeled as “trigger”.
- Manually start the recording of the camera in the PCC software. The red light will light up on the back of the camera indicating the camera is recording.
- Run the ESD machine at the lowest energy level.
- Once the spark occurs, the camera should have triggered, and the red light on the back of the camera blinks and turns off and in the PCC software the trigger button that was previously green is now grey. This confirms that the current trigger is functioning.
- Open the ABL ESD shortcut folder on the desktop. It should be set to C:\Users\yourspecificidname\GoDetectData\ABL ESD. Create a new folder and name it the material being tested, e.g. PETN-15.
- In the PCC software click on the Continous Recording tab.
- In that menu, click 'Browse' and navigate to the desired folder that you just created.
- Type Run@4.cine in the file name box. The software will create a new cine file each time the camera is triggered with the first one labeled Run0001.cine. The prefix for all the files does not have to be named Run.
- In the Save Cine dialogue, click the drop down menu for Range Option and choose User Defined and type [-10,30].
- Click save.
- Click the activate check box.
- Launch the GoDetect™ GUI by opening a browser and typing 'localhost' in the address bar.
- If there is an error and the GUI webpage doesn't appear complete the following 3 steps:
- Verify that docker desktop is running.
- You should see a whale with containers on its back in the icon tray which says 'Docker Desktop is Running' when you mouse over it.
- If not, start Docker Desktop, by searching for Docker Destop in the Windows bar and then starting it.
- Open a Windows Powershell and type 'docker start gdetect'.

- If the result printed in the screen is like that above, the gdetect container was started successfully
- Otherwise, the docker container may have been deleted and you'll need to restart the gdetect container by typing the following in the Windows Powershell prompt: docker run -d -v C:/Users/youridname/GoDetectData:/app/GoDetectData -p 80:80 --name gdetect smswj/godetect
- Retry launching the GoDetect™ GUI by opening a browser and typing 'localhost' in the address bar.
- To change materials, create a folder for the new material as described above in Step 4. Now open PCC. Click on the Continuous recording drop down menu. Uncheck the Active box. Click Browse and navigate to the new material folder and name it Run@4.cine with the same user definitions of [-10, 30] and Save and then Check the Active box under the Continuous recording menu.
GoDetect™ ESD Automatic Detection GUI Instructions
- Navigate to the http://localhost/godetectesd page. The most recent substance and test should be propagated to the dropdowns.
- Click the Determine Outcome Button, and then enter the energy of the trial and enter any notes for that trial.
- Click the Log Data button.
- Repeat the process and complete another test by simply loading the same sample on the ESD electrode and pressing the fire button after charging the capacitors to the desired energy.
- Reload the page (/godetectesd) to update the results with the most recent trial.

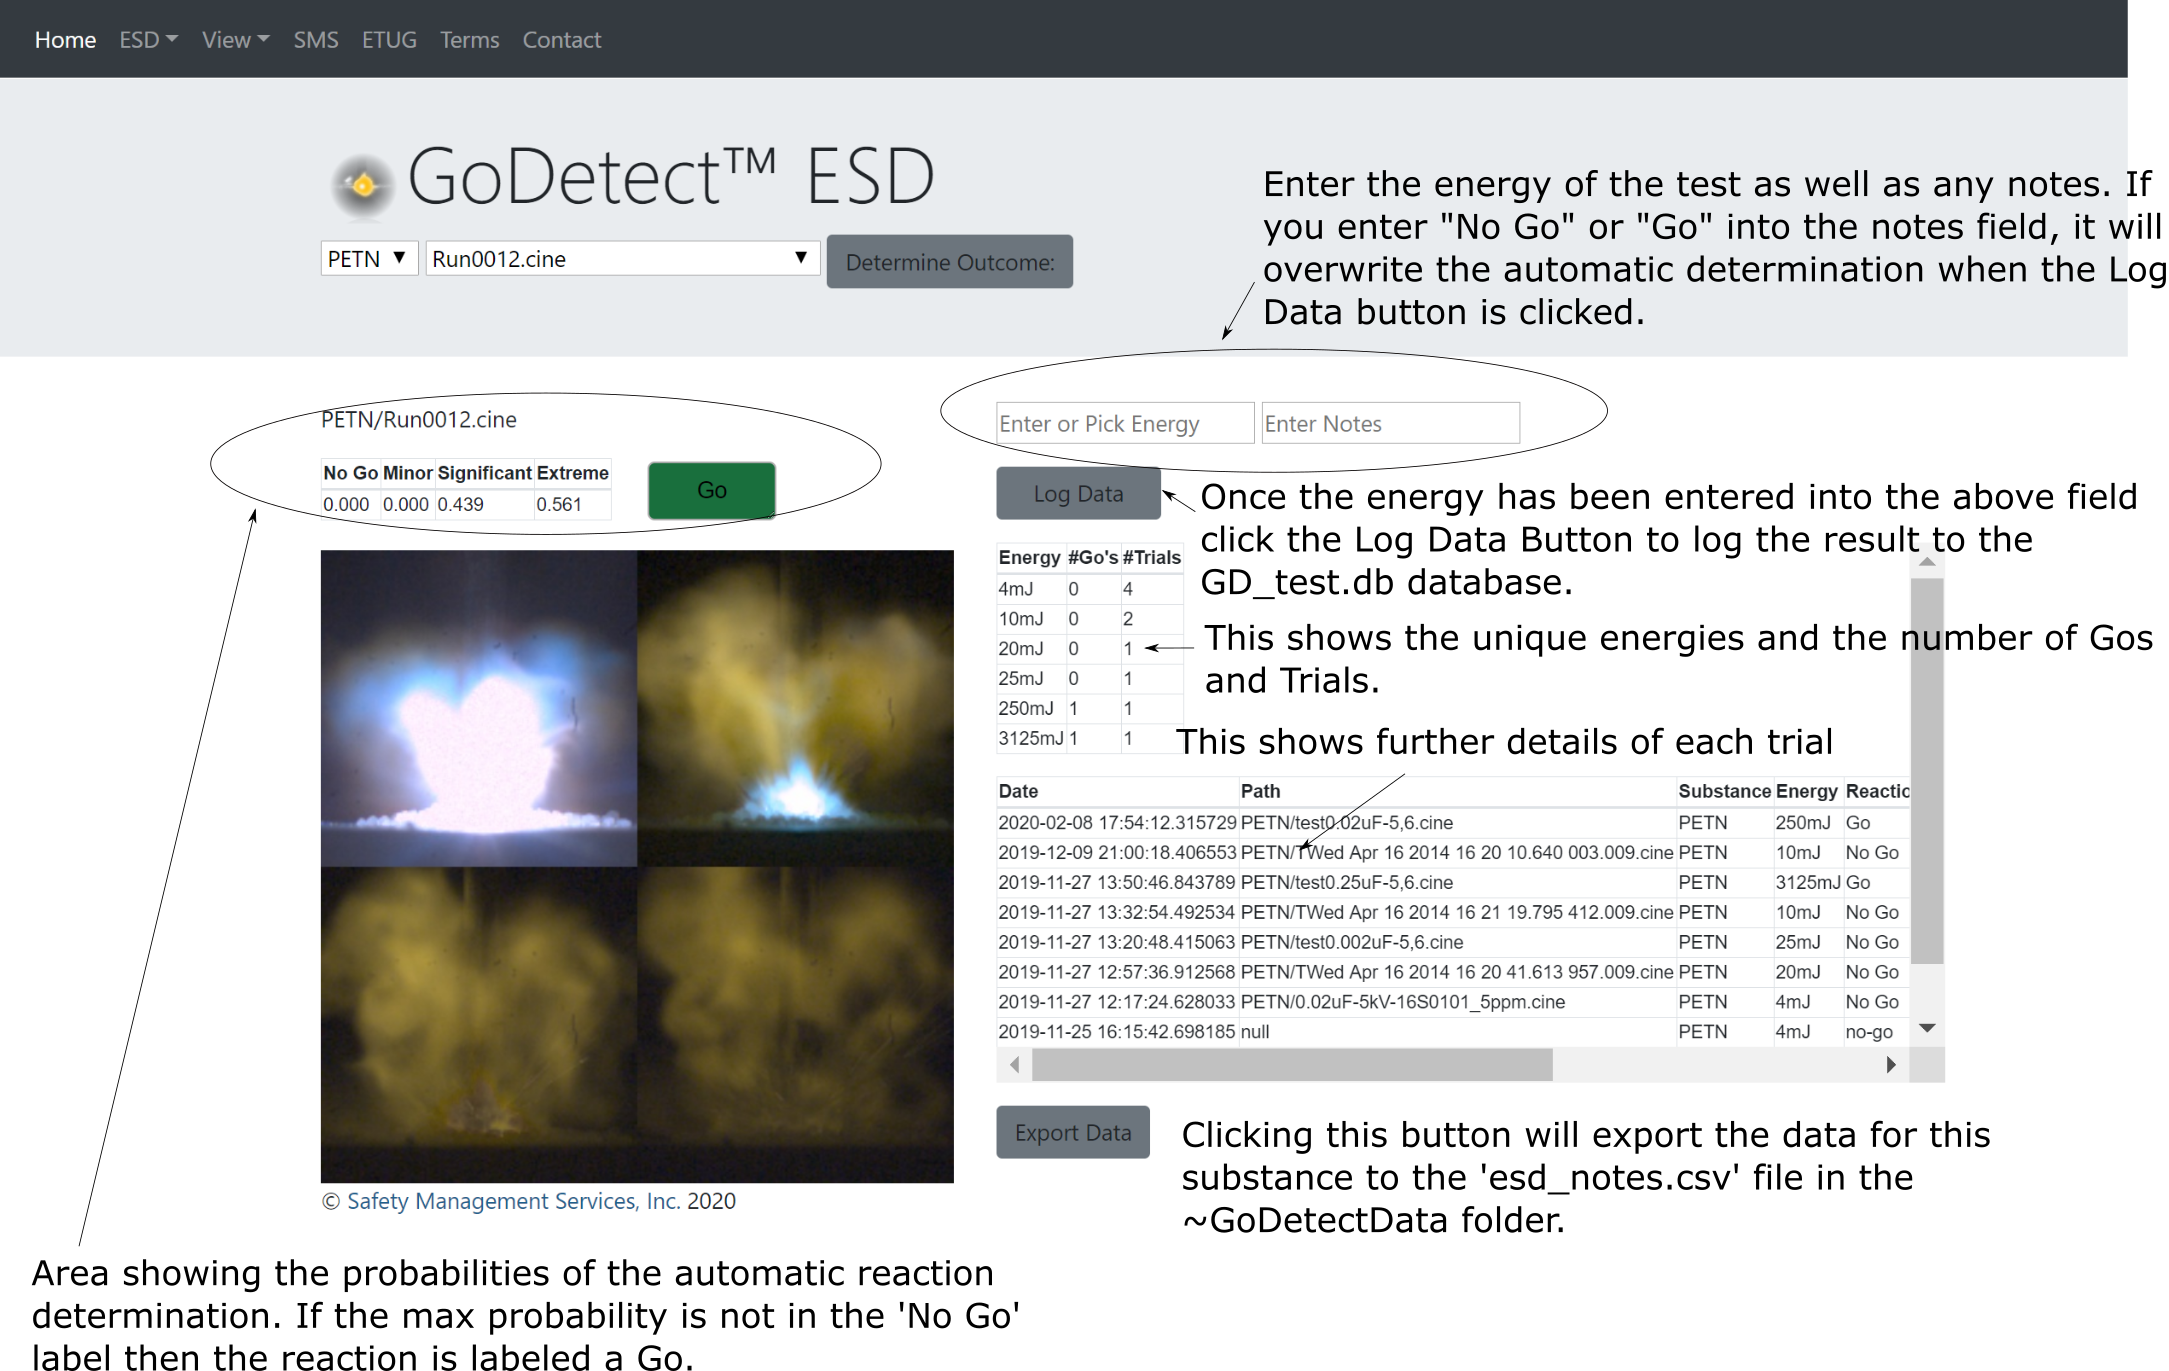
Note that:
- Compiled images of the .cine files shown on the screen are the 4 successive frames including the brightest image at or near the trigger event and are stored in the ./GoDetectver8/statics/images folder in the running Docker container.
- The trigger point marked in the cine file must be within 0-10 frames of the actual spark event, otherwise, the summarized frames will not accurately reflect what is happening.
- The user can change the automated Go designation by entering Go or No Go in the notes field, for instances where some materials initially do not show a reaction and then after a delay, there is an ignition.
- The individual trial results displayed on the page can be exported by clicking the Export Data button. Results are exported in csv fomat here: ./GoDetectData/esd_notes.csv.
- The files in the running Docker container./app/ folder are necessary for the proper function of the web application (GoDetect™ ver 8).
- The model used to identify the probability of a Go can be retrained or updated. If your results are unexpected or are not making sense as verified with a gas analyzer or other objective determination, contact us and we will work with you to update the model to your requirements. It is anticipated that future software updates will include updated models that have a larger training and validation set and the user will have the option to select which model to use, including those that have been customized for a specific non-conforming substance or scenario.
- GoDetect version 8 was developed using Chrome. Other browsers may not work as well.
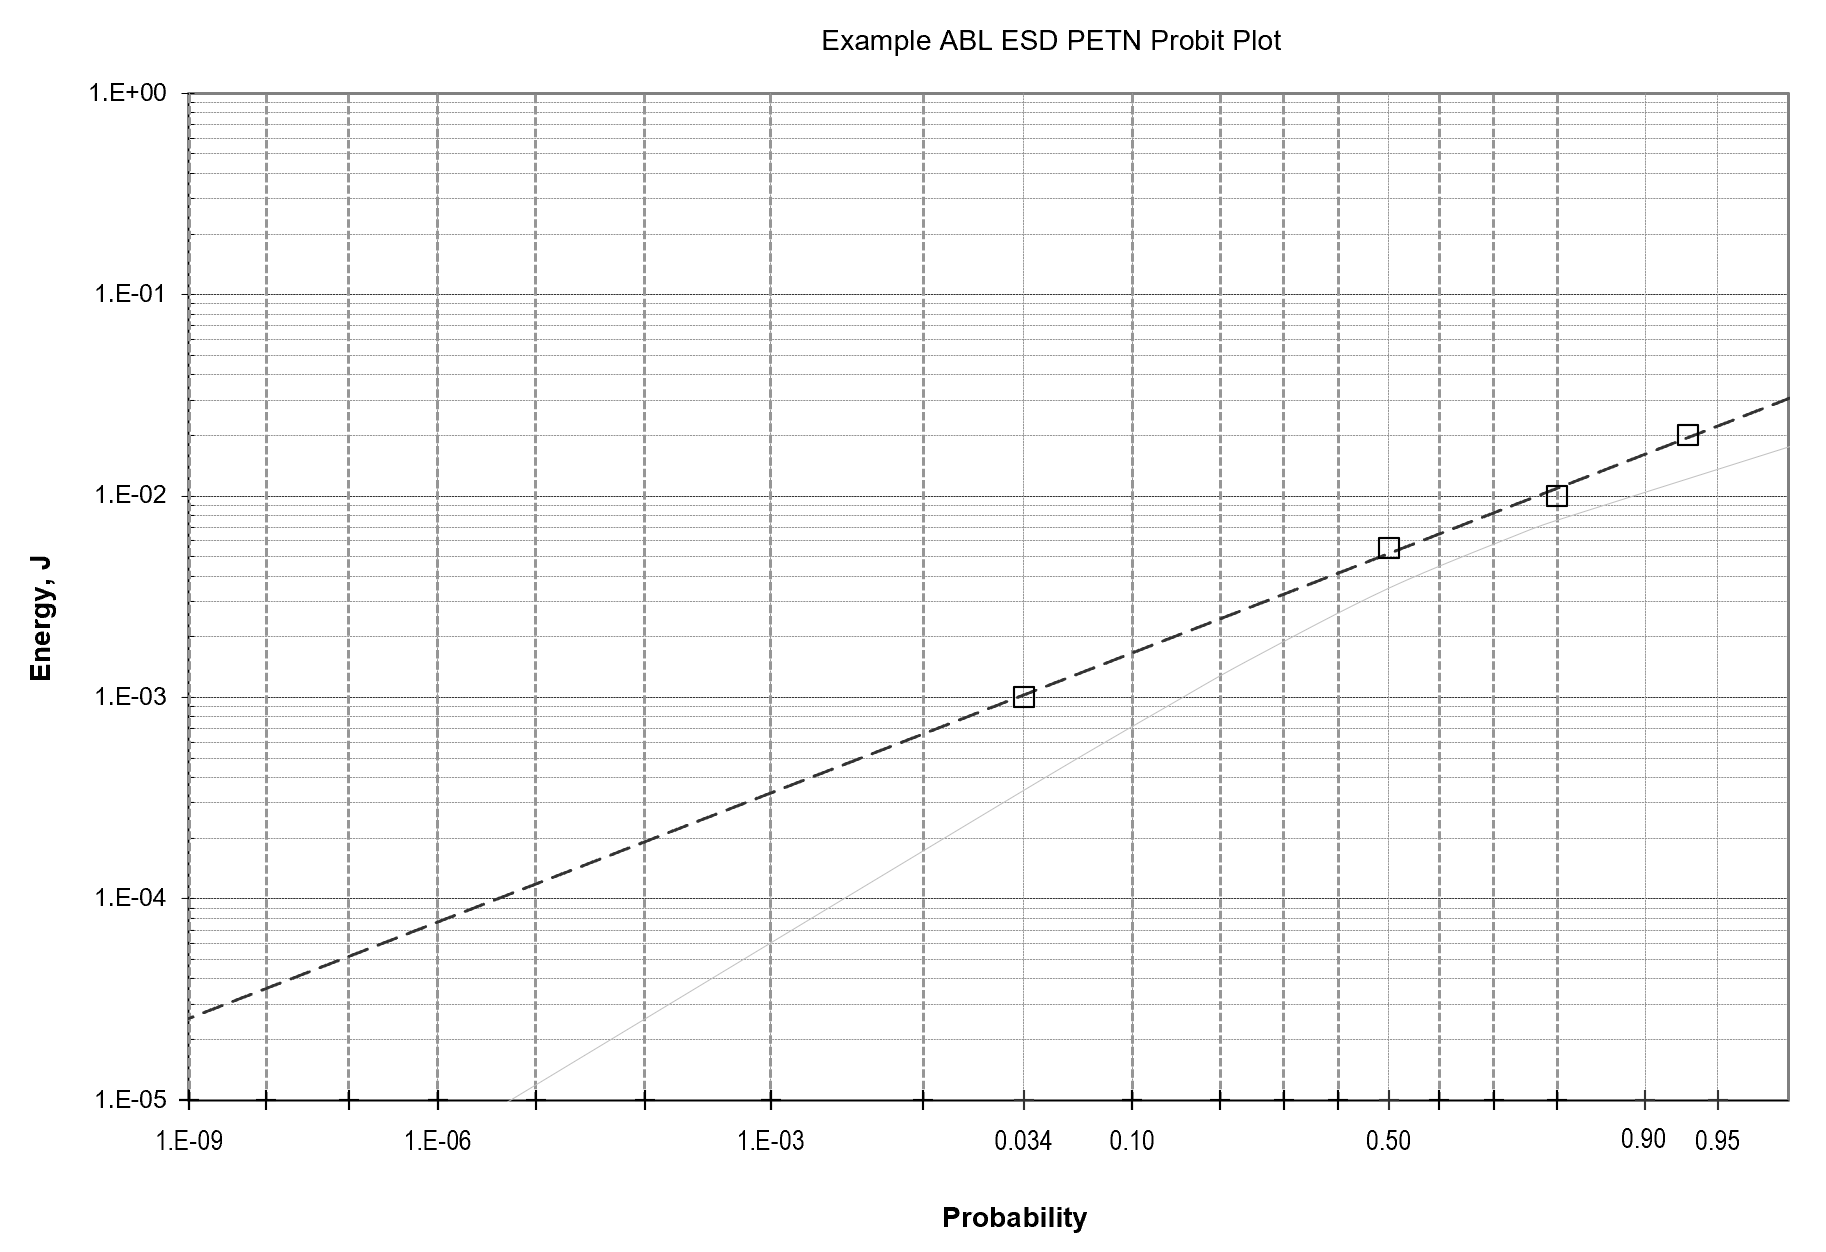
GoDetect™ Characteristic Curves or Probit Plots
The characteristic curve or probit plot relates the energy of the impetus to the probability of a reaction event. Such a curve can be easily generated by first opening the SMSPROBITTemplate_V1.xls file under the GoDetectData folder. The table generated in the GoDetect™ web application for either ESD or View showing the setting, number of Go's, and number of Trials is then simply highlighted with the mouse and then copied into the excel sheet. The setting can then be modified to give the appropriate number value and the probit curve determined and plotted by clicking the Calculate button.
 |
 |
| Probit sheet. | Example ABL ESD probit plot. |
|
Note that GoDetect™ version 8 for ESD includes probability determination for Minor, Significant, and Extreme reactions correlated with the amount of CO given off from a small test sample. Using those probability determinations, can be used to calculate characteristic curves or probit plots for those same reaction levels. An example of such a plot for PETN is below. The variability seen at higher energy levels is due to the limited data at those higher energies. This feature represents an extension of the methodology typically used in completing Small-Scale-Sensitivity Testing (SSST). The data to compete a similar plot is available in this release of GoDetect. Automated generation of the plot is expected in an upcoming version.
 |
| Example ABL ESD plot showing future implementation to determine reaction probabilities at multiple reaction levels. The underlying curves are the average probabilities for each reaction level for each tested energy for PETN. The cumulative probability curves is a fit based on the peak heights and widths of those probability curves. Further details and information to be released in a software update. |